Dashboards🔗
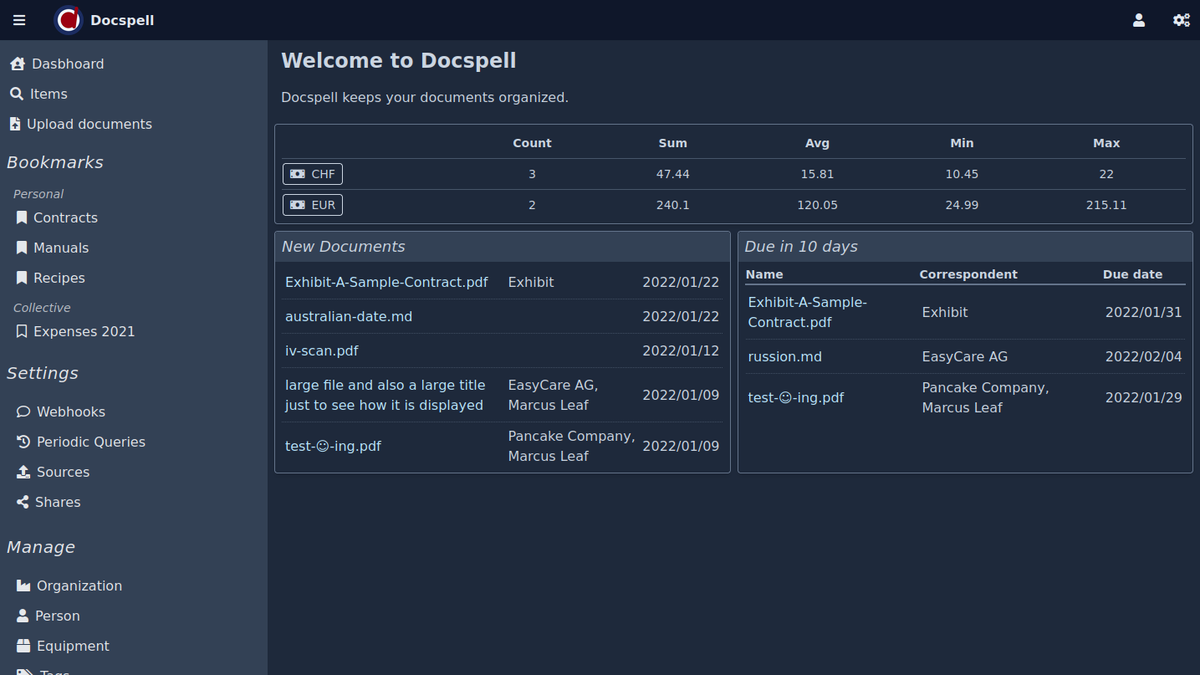
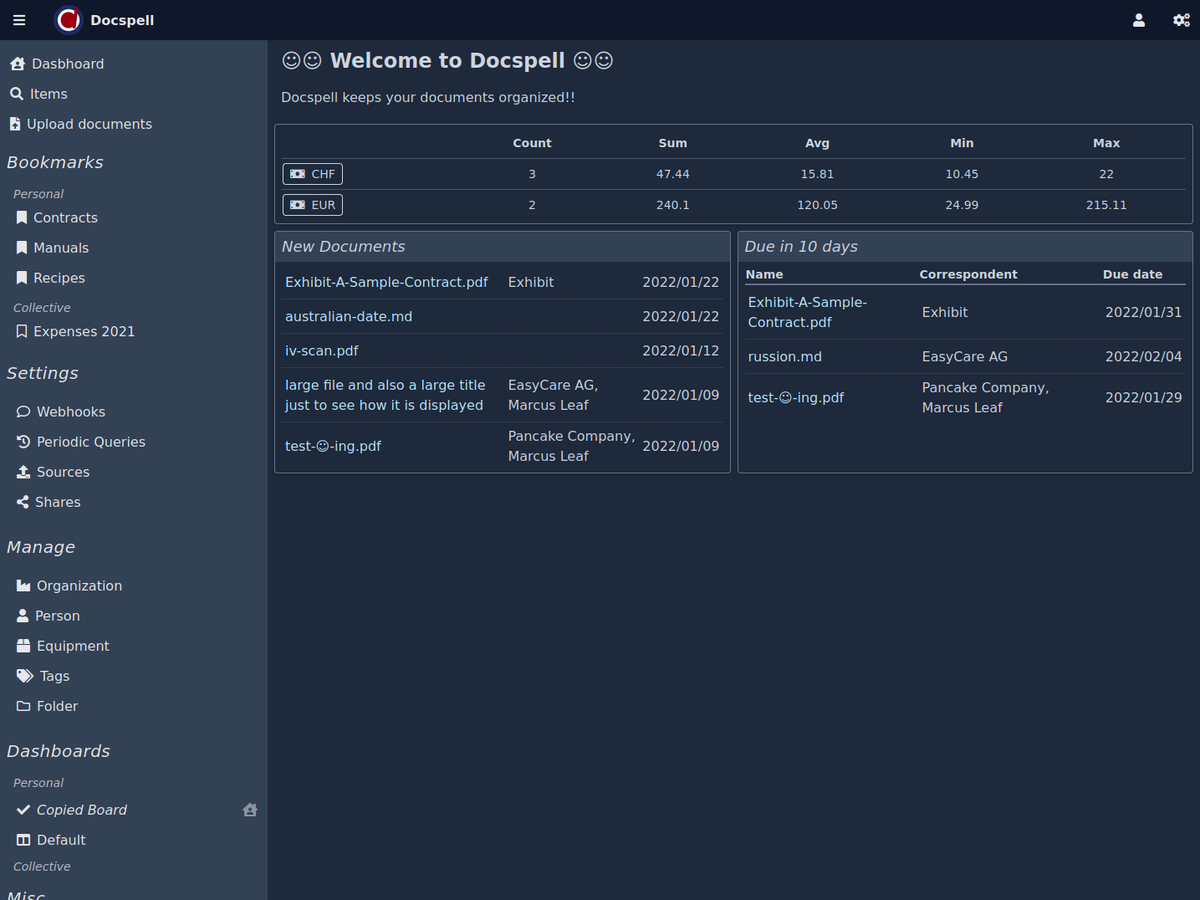
The main page shows a dashboard displaying some aspects of your documents. The following is the default dashboard that is bundled in the application:
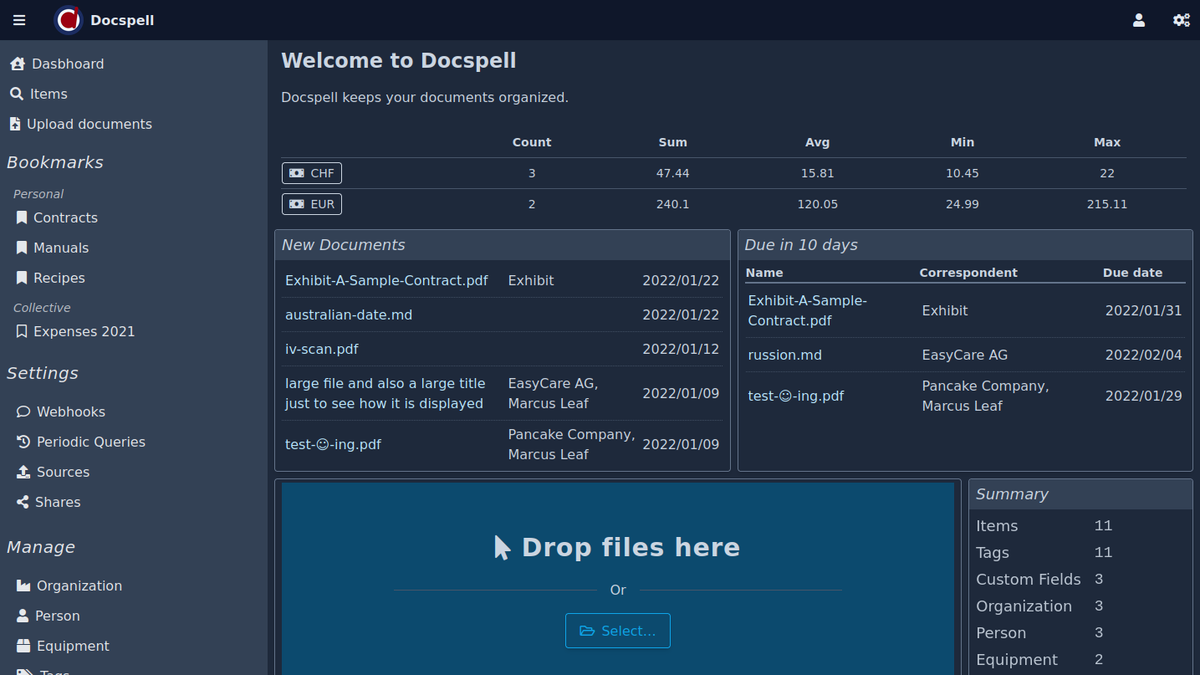
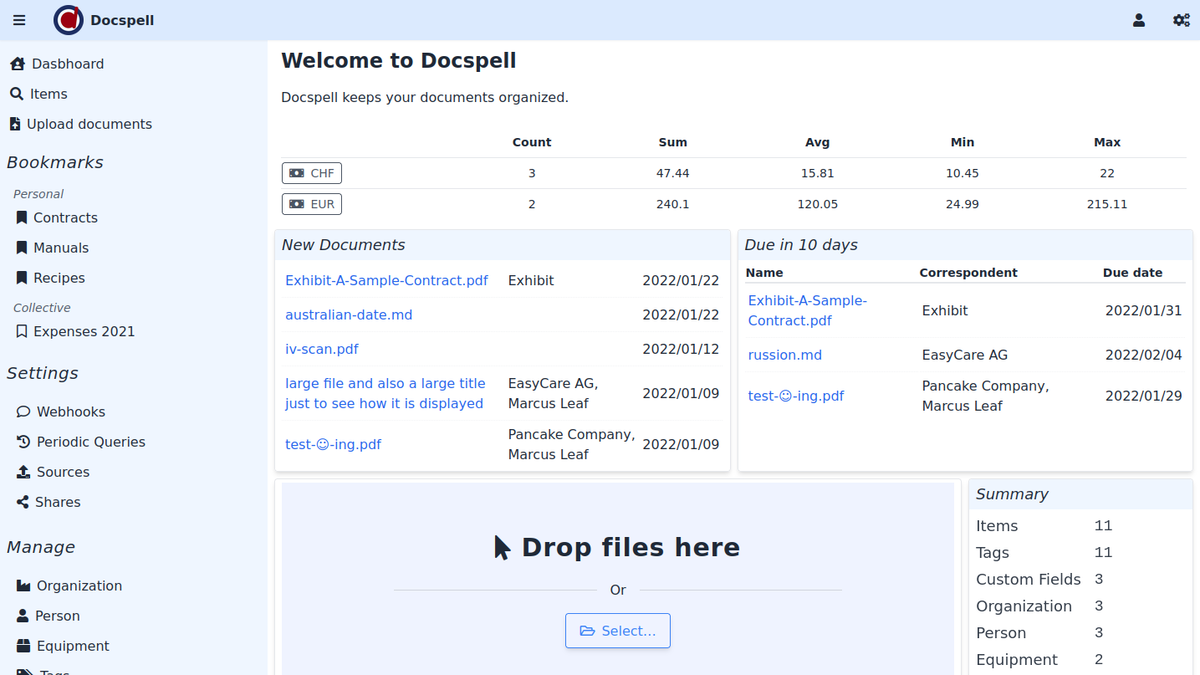
The dashboard can be customized. You can create multiple dashboards and switch between them. One dashboard is always the "default" which is shown when the page loads. It either is a custom one or the predefined one above.
Side menu🔗
The side menu contains a list of useful links. The first loads the default dashboard. All others links (and more) are available through the top-right menus as well.
The Bookmarks section shows all your bookmarks and a click takes you directly to the search page with the corresponding bookmark active.
The Settings section contains some links to useful settings and the Manage section has links to metadata that can be managed separately. These links are fixed and cannot be changed.
Dashboard properties🔗
The main component on this page is the "dashboard". A dashboard has the following properties (all required):
- name: which must be unique among all dashboards
- columns: the dashboard is a grid that has this number of columns, where each box can span any number of columns
- gap: defines the gap between boxes
- scope: (Personal or Collective) whether it is a personal or a collective dashboard. Personal dashboards can only be seen by its user, whereas collective dashboards can be used by all users of a collective. Every user can change/delete collective dashboards.
- default wether this dashboard is the default one and will be displayed when the page is loaded
- a list of boxes that define the content
Customizing🔗
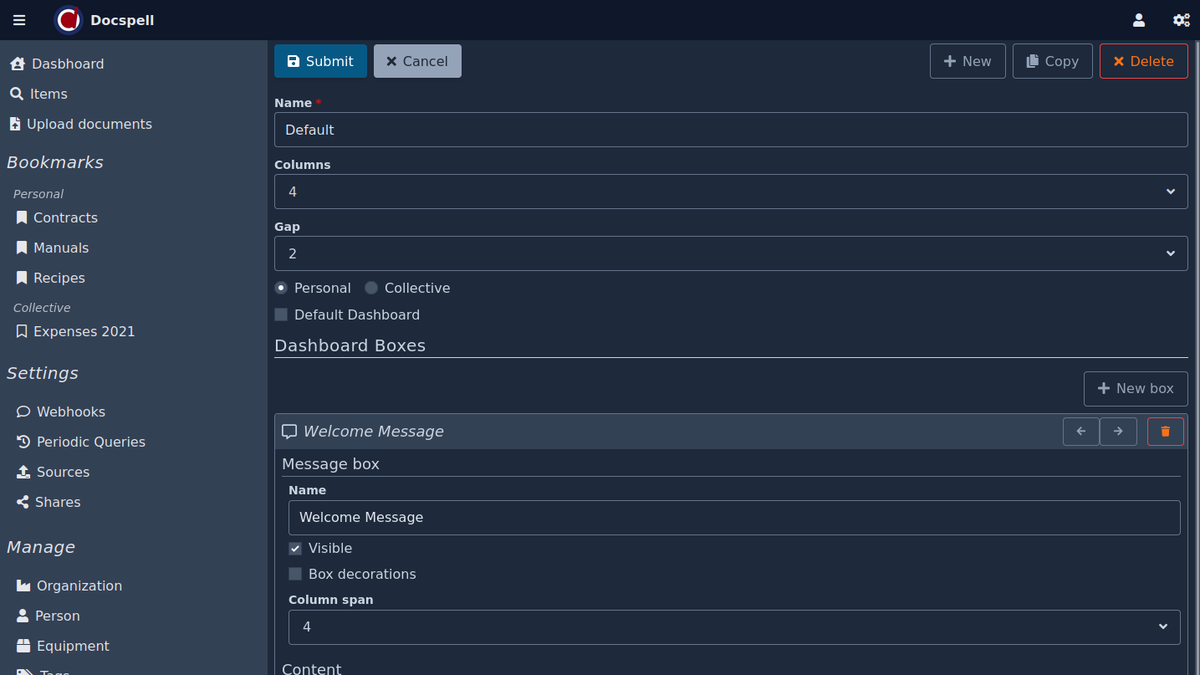
When clicking on Edit Dashboard down in the side menu, the currently viewed dashboard changes into a form that show the dashboards properties. You can change the content by changing, moving, adding and removing boxes and the dashboard properties.
Editing dashboard properties🔗
After clicking Edit Dashboard the dashboard changes into a form:
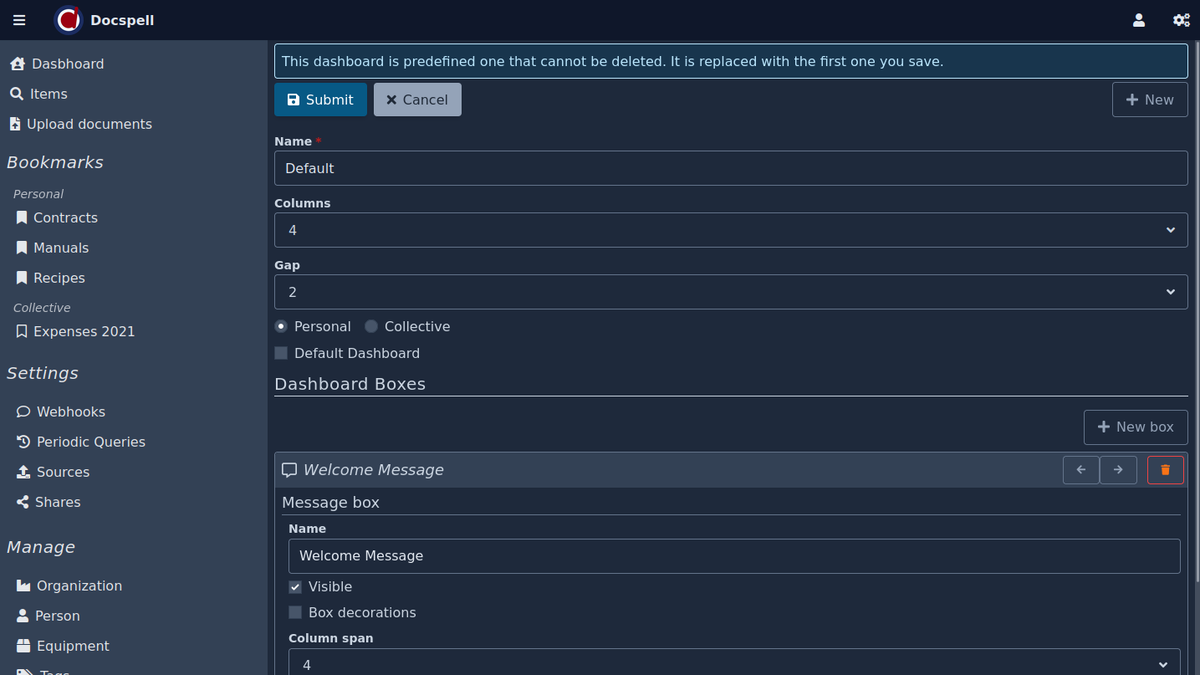
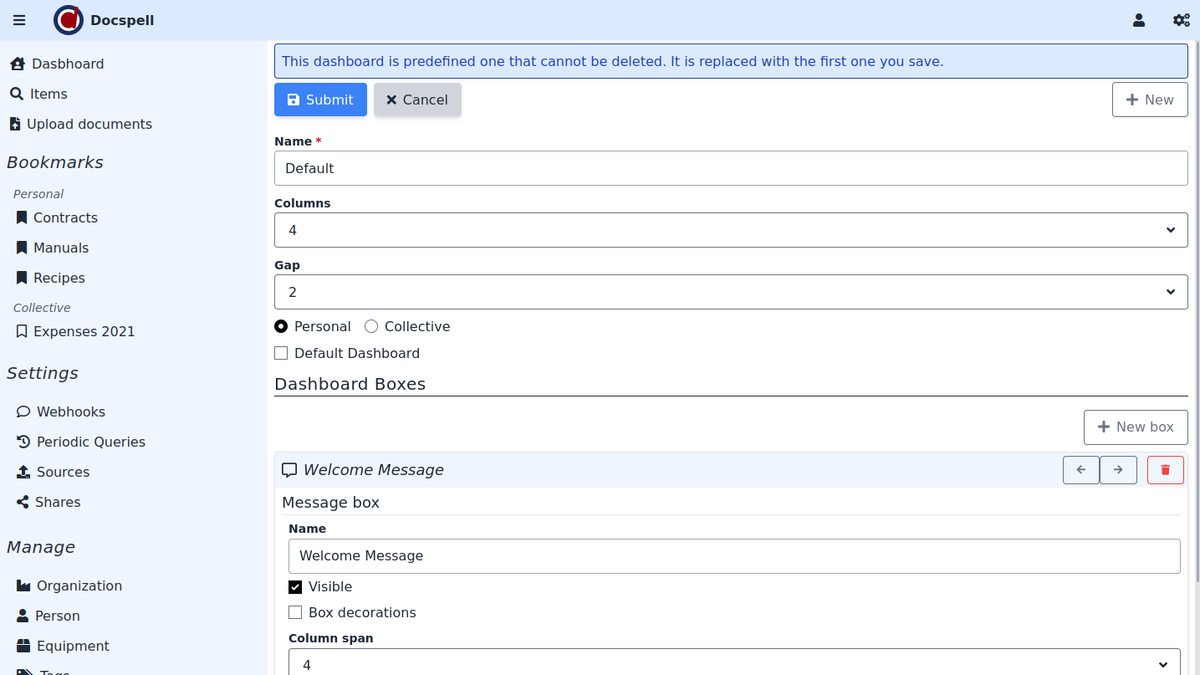
Note the message on the top: it indicates that this dashboard is the bundled one that is used only if there are no custom ones available. That's why you can't delete it, for example. As soon as you click save, the configuration is stored at the server and the bundled dashboard will not show up again - until you delete all of your custom ones.
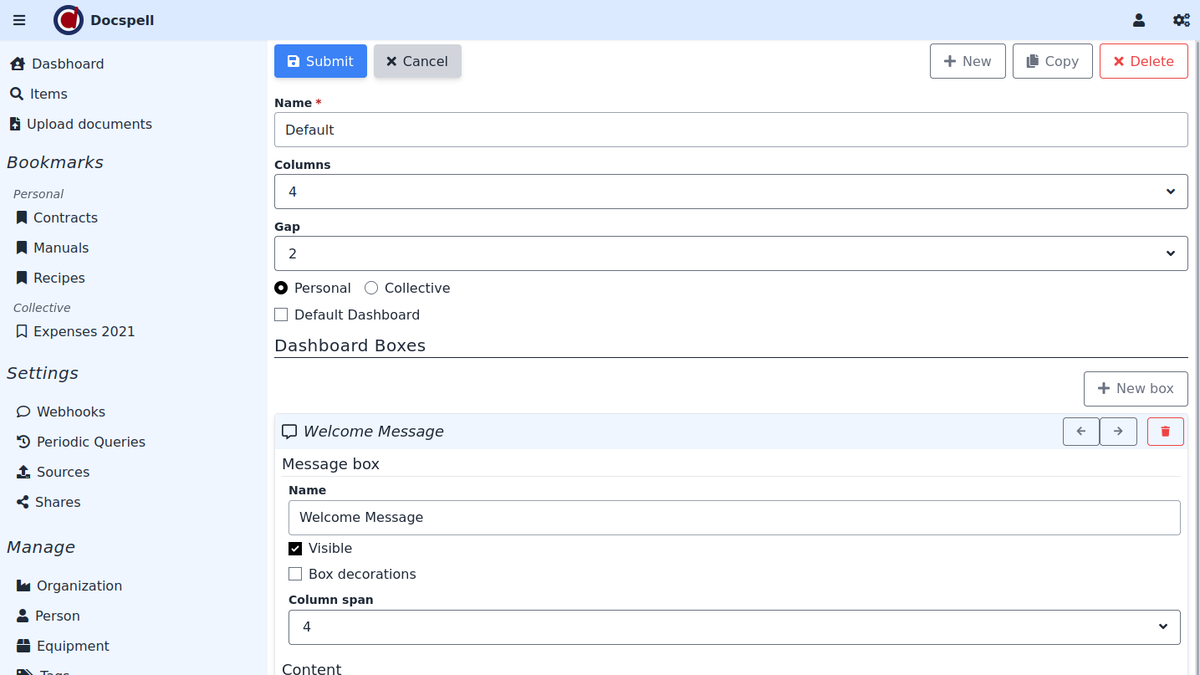
A dashboard must have a unique name, in this example the name is just left as is. You can change things by using the forms and you can reorder the boxes using the arrow buttons or drag and drop. When satisfied, click Submit. In the example, the last two boxes are removed and box decorations are enabled for the field overview box.
When you now edit this dashboard again, the message is gone and you can change the dashboard and also delete it. You can also create a new dashboard or copy the current one.
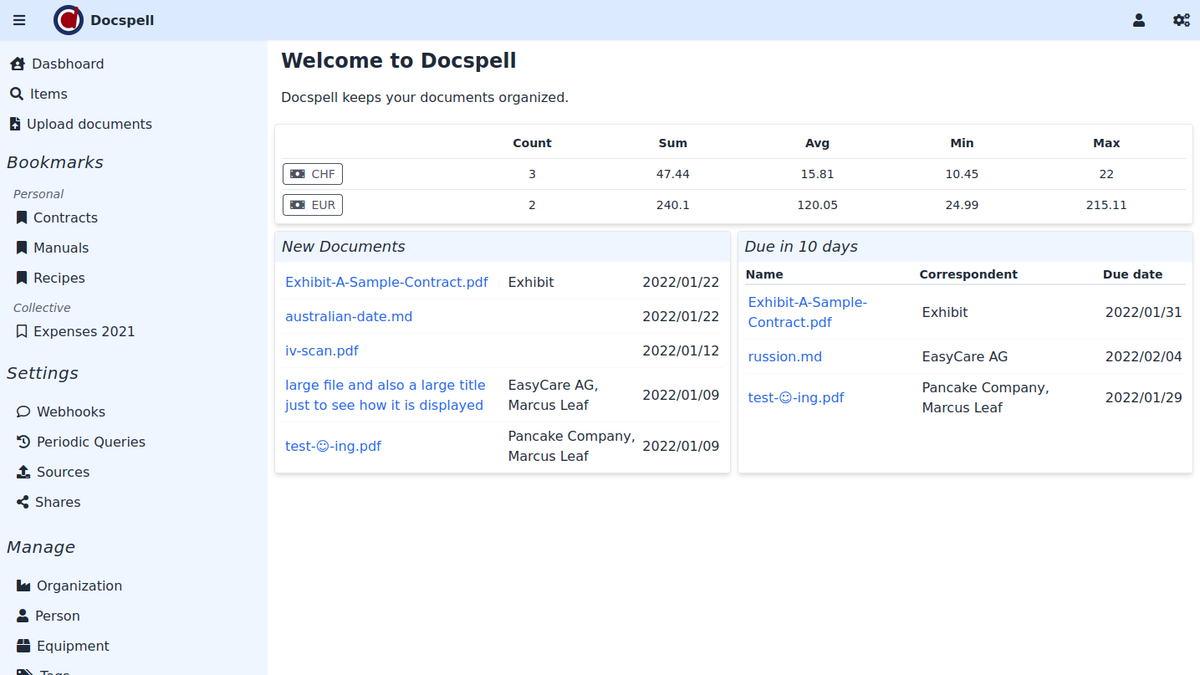
In this example, the dashboard was copied, then the message was changed and it was set to the default dashboard. This is how it looks now:
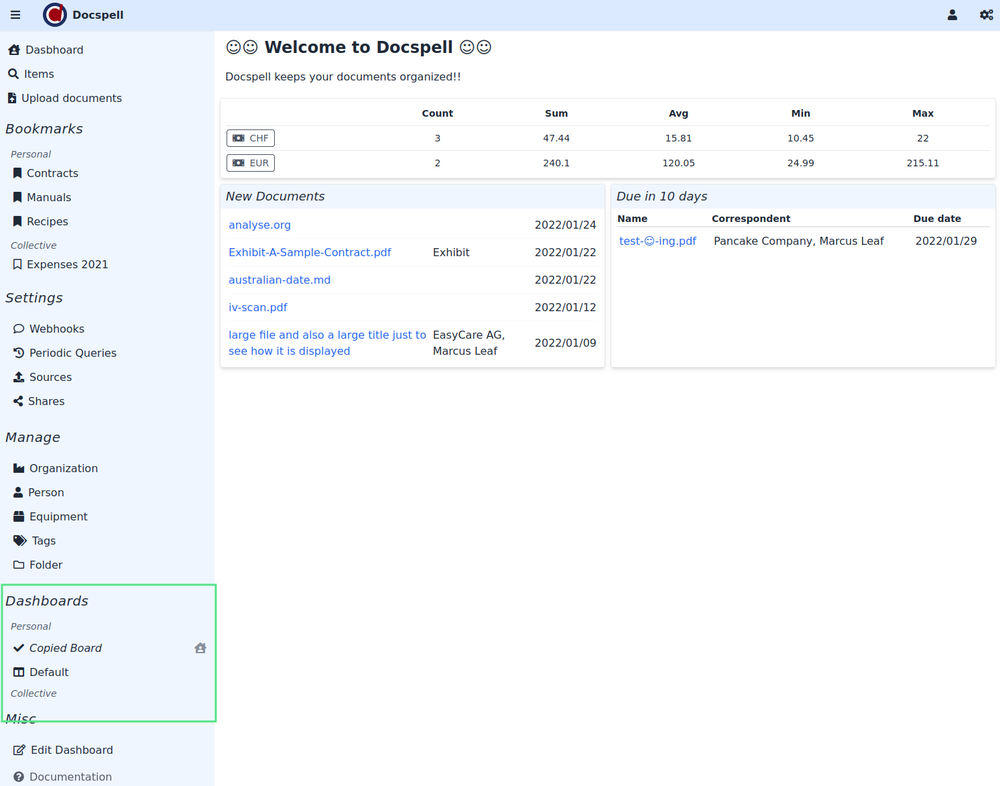
When there is more than one dashboard, the side menu shows all of them. The little house icon indicates whether this is the default dashboard. You can click on any dashboard in order to load it.
Content🔗
Message🔗
The simplest form is a message box that displays a title and a body. Both fields support markdown for basic formatting.
Upload🔗
The upload box can be used to show a file upload form. It can be optionally configured with a source. If no source is configured, it is just the main upload form using all default settings (skip duplicates, using the collective langauge etc).
Stats🔗
The stats box can display basic statistics given a search query or a bookmark. The query can be empty, which means to not restrict the results.
It is possible to display the numbers in a simple table or show an overview of some custom fields.
Query🔗
The query box can be used to display a table of documents returned from a search query or a bookmark. You can choose from a set of columns what to display. The first column will always be rendered as a link to the corresponding item.